Economics: Charting Life Cycle Costs
- Life cycle costs
- Payback
Discussion
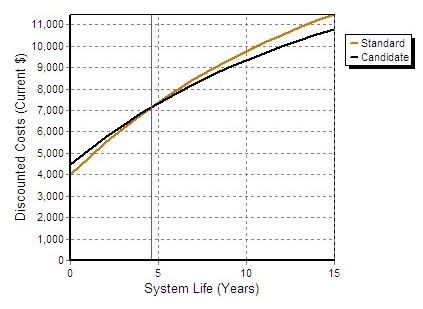
This chart is produced when the RTU Comparison Calculator is run. It shows discounted (to present day value) costs for both the candidate and base units, each year, over the specified system life. Cross over point shows the payback time when the candidate unit's lower operating costs recover any difference in initial cost.